We use Key Performance Indicators (KPIs) to assess performance in meeting our strategic and operating objectives.
Performance is measured against the following financial, operating and sustainability KPIs:
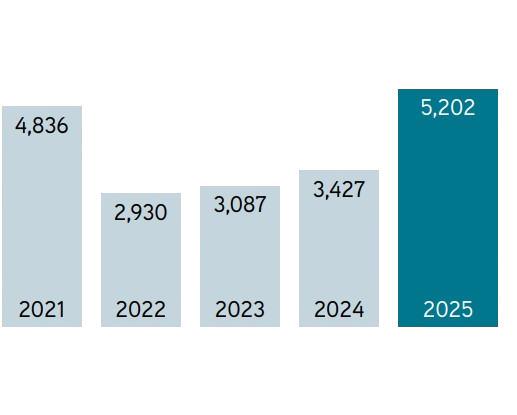
$5,202m
Why it is important
This is a measure of our underlying profitability
Performance in 2025
EBITDA was $5,202 million, 52% higher than 2024 on stronger revenues and robust cost control, which helped to increase the Group’s EBITDA margin to 60% (2024: 52%).
1. Non-IFRS measure; refer to the Alternative Performance Measures section on page 243.
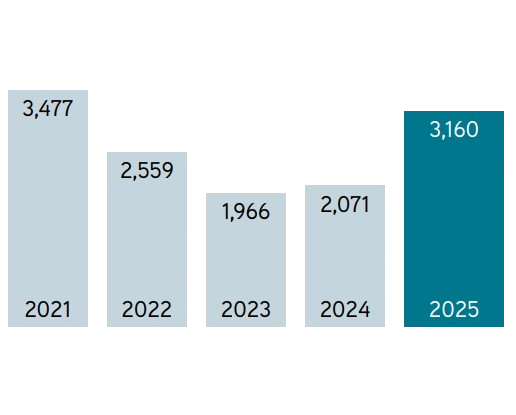
$3,160m
Why it is important
This is a measure of our profitability before the deduction of taxes.
Performance in 2025
Profit before tax (including exceptional items) was $3,160 million, 53% higher than 2024 due to higher revenues (higher copper and by-products prices), partly offset by higher depreciation and amortisation.
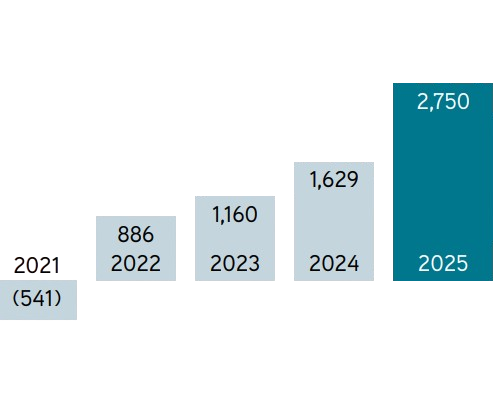
$2,750m
Why it is important
This measure reflects our financial liquidity.
Performance in 2025
Strong balance sheet with net debt of $2,750 million at the end of 2025 and a net debt/ EBITDA ratio of 0.53x (2024: 0.48x).
1. Non-IFRS measure; refer to the Alternative Performance Measures section on page 243.
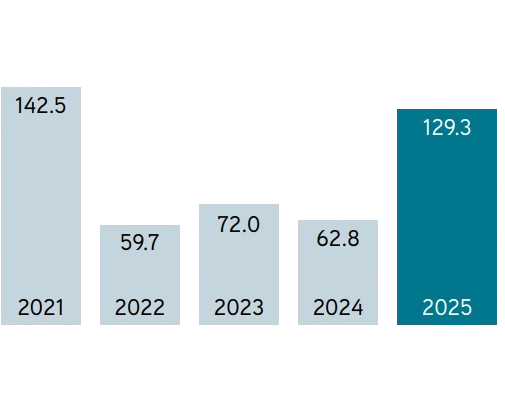
$129.3¢
Why it is important
These are measures of the profit attributable to shareholders before exceptional items.
Performance in 2025
Earnings per share including exceptional items for the year were 60% higher at 134.8 cents, compared with 2024, reflecting higher underlying profit after tax.
*2. Including exceptional items
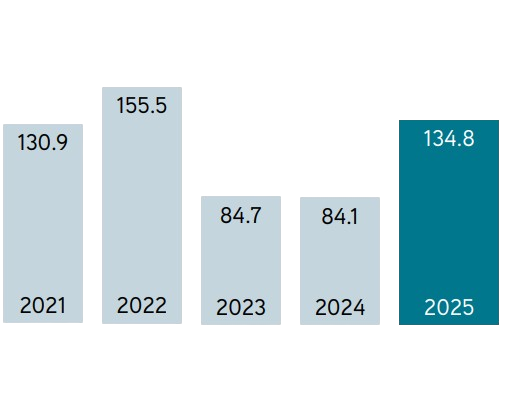
$134.8¢
Why it is important
These are measures of the profit attributable to shareholders after exceptional items.
Performance in 2025
Earnings per share including exceptional items for the year were 60% higher at 134.8 cents, compared with 2024, reflecting higher underlying profit after tax.
*3. Including exceptional items
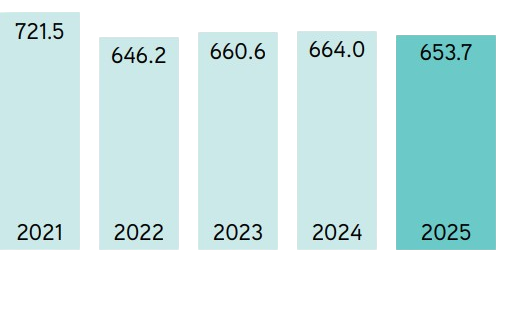
653.7 kt
Why it is important
Copper is our main product and largest source of revenue.
Performance in 2025
Copper production decreased by 2% to 653,700 tonnes, representing a balance between increased output at Centinela Concentrates and a lower contribution from Centinela Cathodes and Los Pelambres
*5. 100% of Los Pelambres, Centinela and Antucoya, and 50% of Zaldívar’s production.
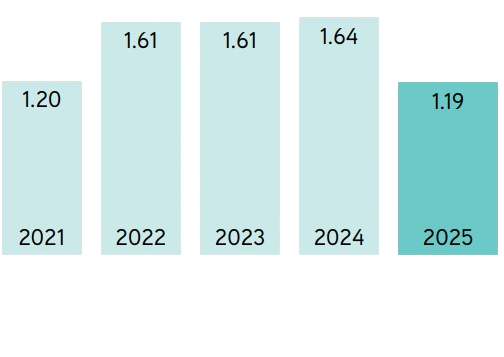
$1.19/lb
Why it is important
This is a key indicator of operating efficiency and profitability.
Performance in 2025
Net cash costs for 2025 were $1.19/lb, a 27% decrease year-on-year, following an increase in the production of gold and molybdenum by-products and stronger gold prices.
*1. Non-IFRS measure; refer to the Alternative Performance Measures section on page 243.
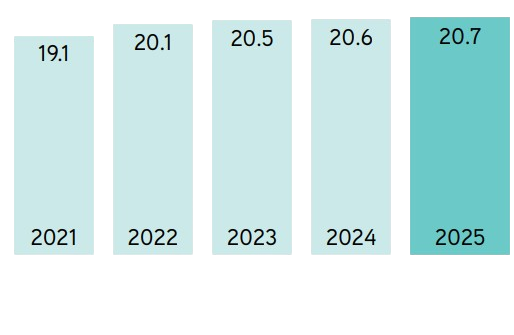
20.7bn tonnes
Why it is important
Our mineral resource base supports our strong organic growth pipeline.
Performance in 2025
Total mineral resources increased by 148 million tonnes during the year, following work at Centinela.
*6. Mineral Resources (including Ore Reserves) relating to the Group’s subsidiaries on a 100% basis, and Zaldívar on a 50% basis.
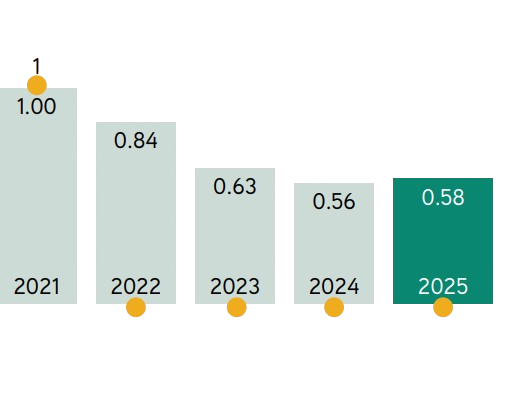
0 Fatalities
0.58 LTIFR*
Why it is important
Safety is our top priority, with fatalities and the LTIFR** being two of our principal measures of performance.
Performance in 2025
Strong safety performance with no fatalities and the Group’s LTIFR remaining below 1.0.
*7. LTIFR for 2024 of 0.56 is restated (previously 0.57).
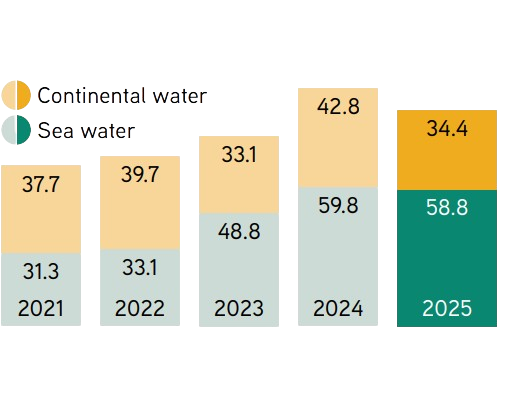
93.2 GL
Why it is important
Water is a precious resource and we are focused on using the most sustainable sources and maximising its efficient use.
Performance in 2025
The use of sea water as a proportion of total withdrawals increased to 63% in 2025 (2024: 58%).
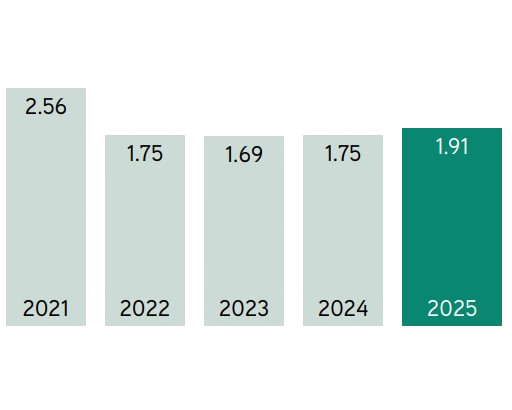
1.91 tC02e/tCu
Why it is important
We recognise the risks and opportunities arising from climate change and the need to measure and mitigate greenhouse gas (GHG) emissions.
Performance in 2025
The Mining Division’s CO2e emissions intensity increased by 9% in 2025 (includes contractor emissions).
*9. Scope 1 and 2, Mining Division only
*10. Tonnes of CO2 equivalent per tonne of copper produced